Data Analytics🤖 AI Assisted
Tableau
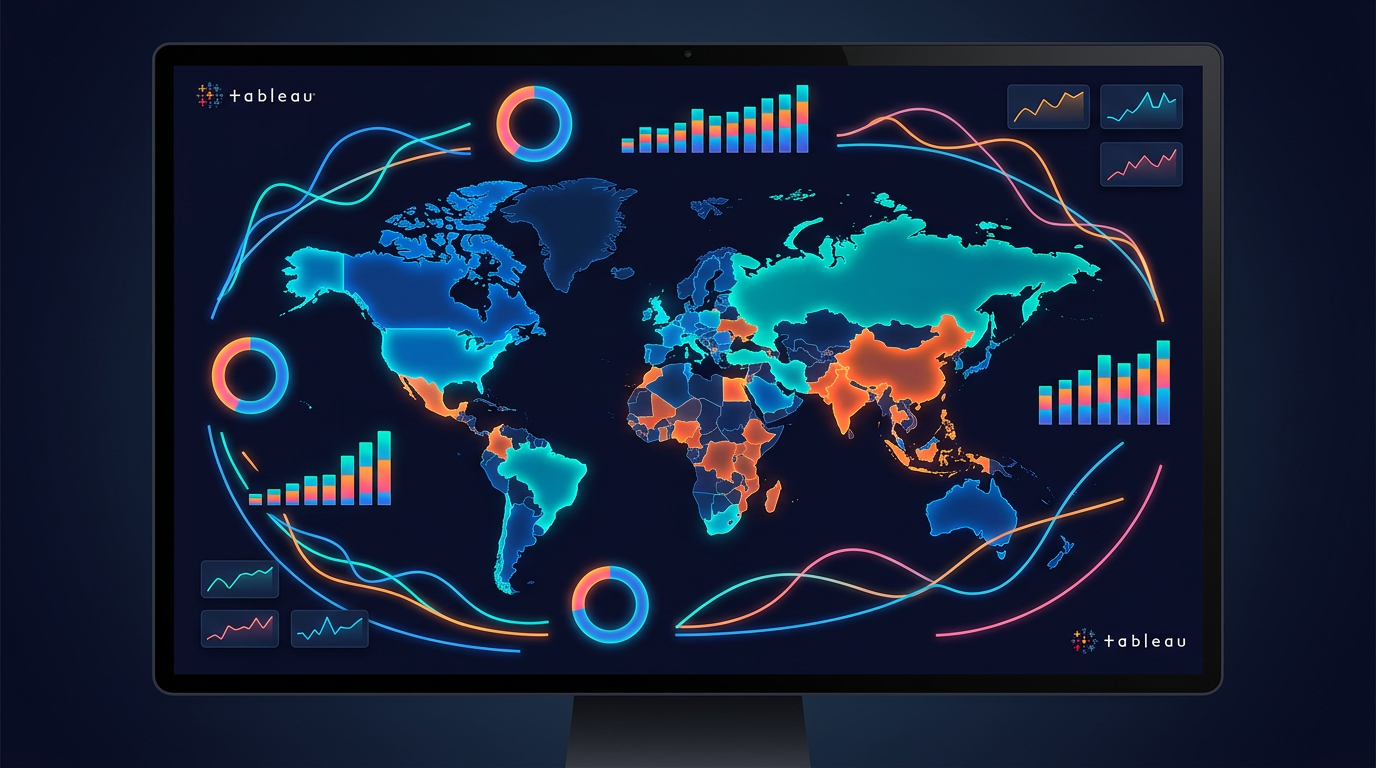
Tableau is the world's leading data visualisation tool. Learn to build beautiful, interactive dashboards that tell a story and drive business decisions.
6 Weeks
Beginner to Intermediate
Weekdays & Weekends
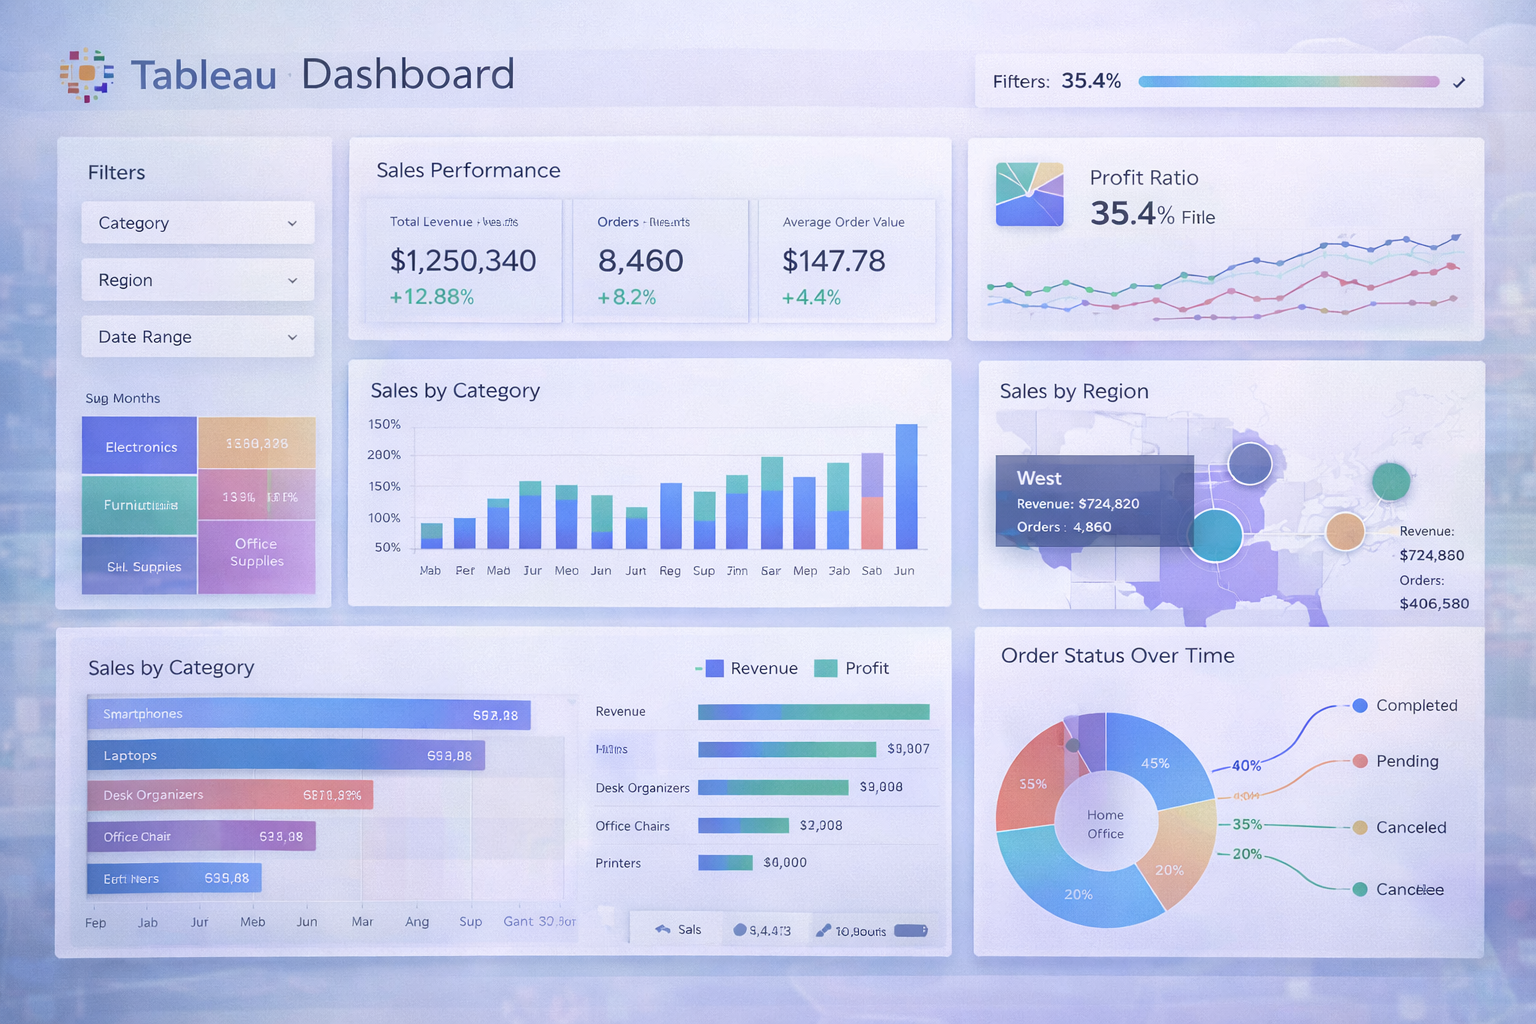
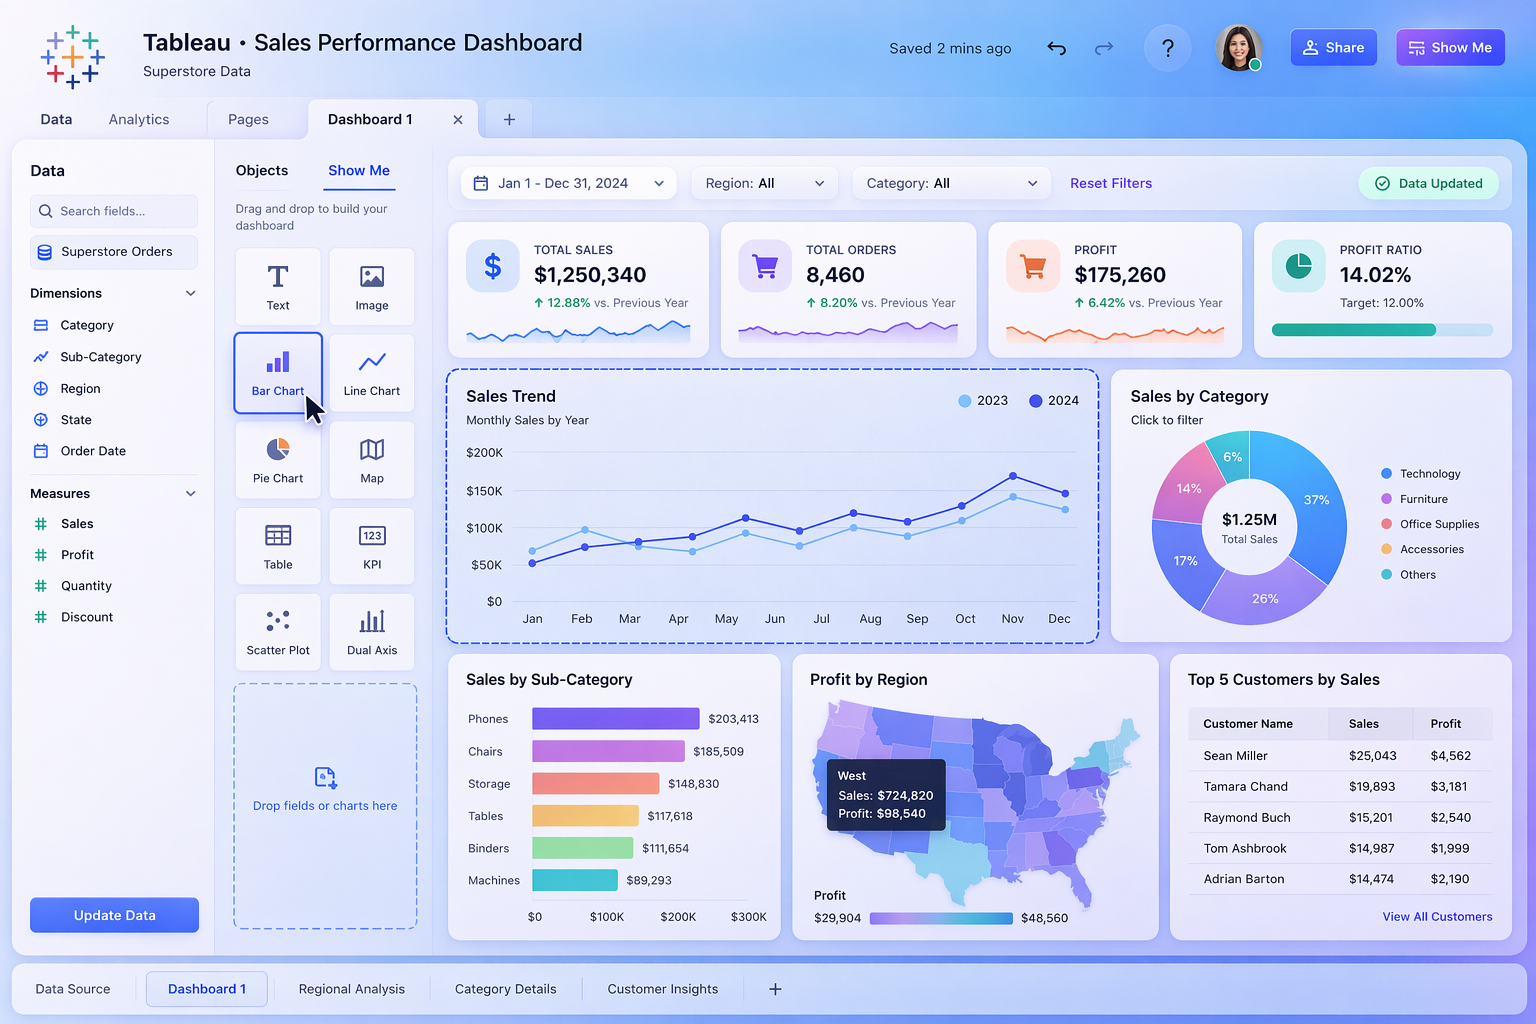
Dashboard Preview 1
Quick Facts
- Duration6 Weeks
- LevelBeginner to Intermediate
- ScheduleWeekdays & Weekends
- Modules4 Modules
- LocationPunjagutta + Online