Data Analytics AI Powered
Power BI with AI
Learn to build stunning, interactive dashboards using Microsoft Power BI. Connect to any data source, write DAX formulas, and publish reports your stakeholders will love.
8 Weeks
Intermediate
Weekdays & Weekends
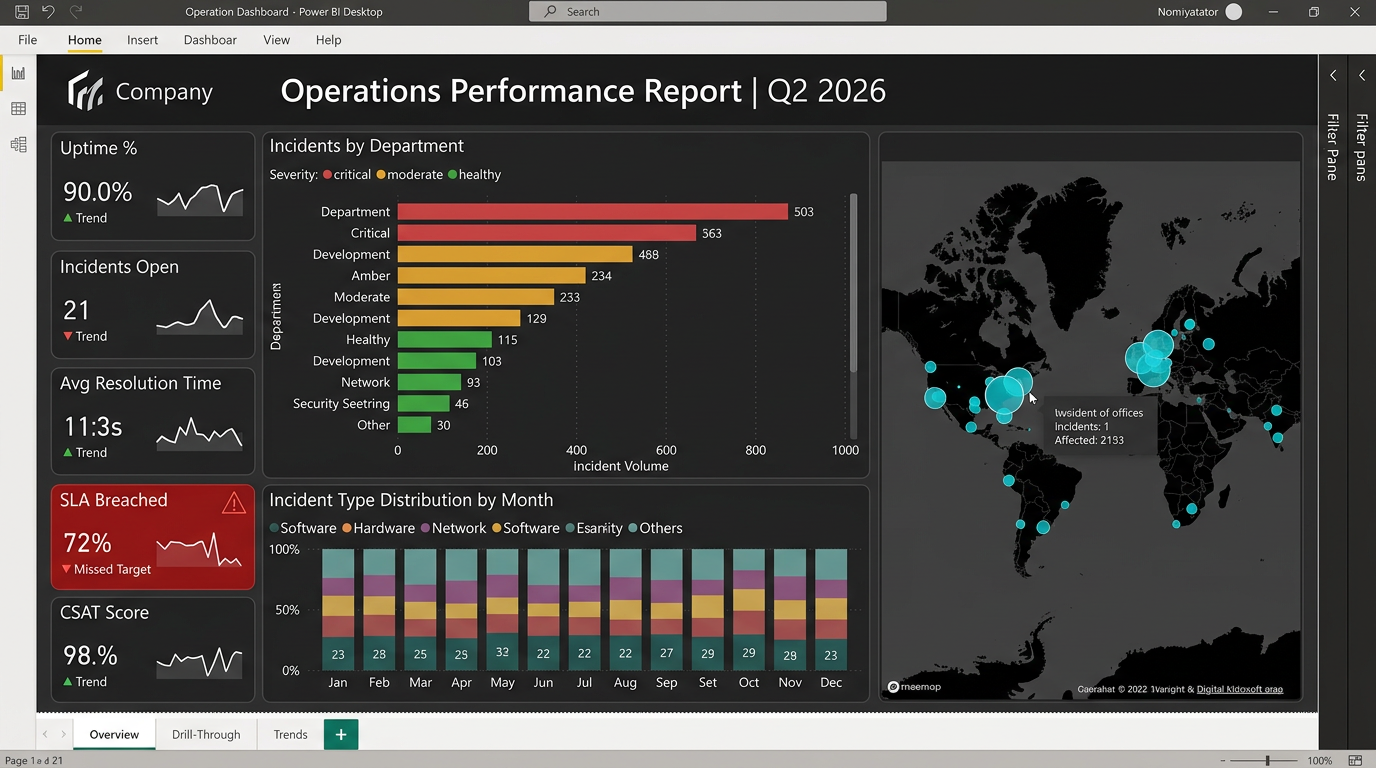
Dashboard Preview 1
Quick Facts
- Duration8 Weeks
- LevelIntermediate
- ScheduleWeekdays & Weekends
- Modules6 Modules
- LocationPunjagutta + Online